Usage
Verify that all services are working
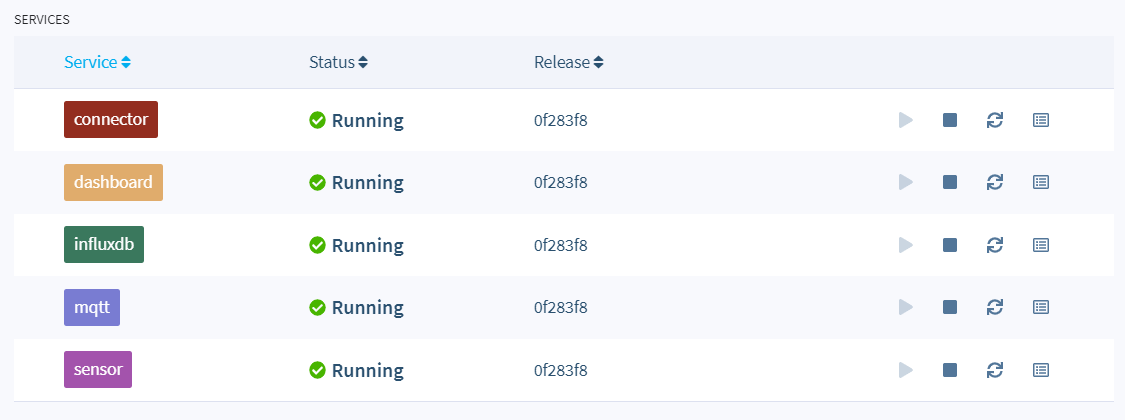
After following all of the instructions on Getting Started, ensure all the services are running on your device.
If everything worked out correctly, after a few minutes your device information screen in the dashboard should look something like this, showing the services running, one for each of the software components. (If not, check out our troubleshooting guide or head over to the forums where we can help you out.)
Accessing your dashboard
As part of an Open Fleet
If you added your device to the balenaSense Open Fleet, you can access your dashboard locally by visiting http://balena.local in your browser.
As your own fleet or forked setup on balenaCloud
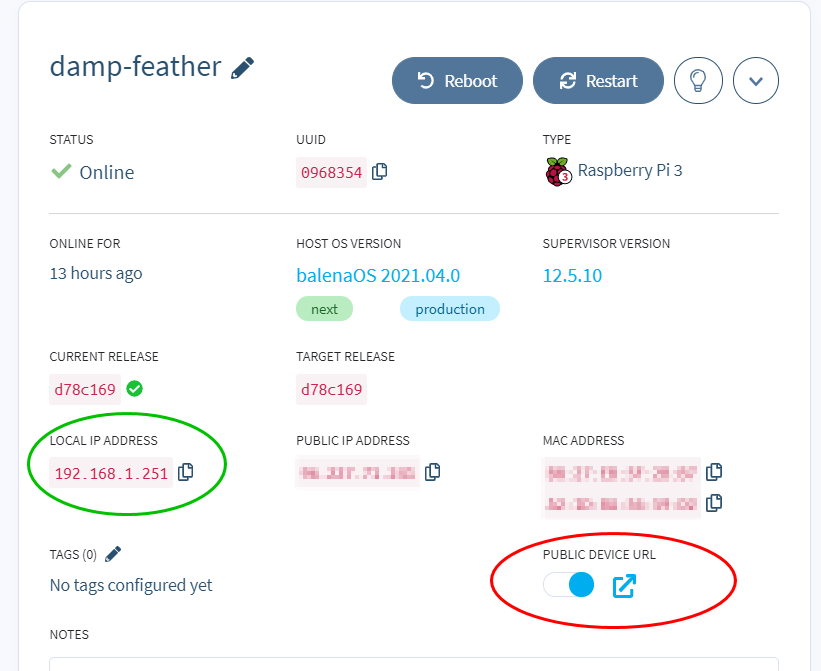
If you're using balenaSense on a device on balenaCloud, you can use the built-in VPN and remote URL to access your device's dashboard remotely. You can access this URL from anywhere where you have internet access.
If you don’t want to enable the public device access, you can still view the dashboard from within your own local network by using the IP address value from the image above (green encircled area.) Yours will be different, but if you enter http://your-ip-address into a browser, you’ll still be able to access the dashboard as long as you’re on the same network as the device. For example, to access my device I would use http://192.168.1.251.
Remember that if you have multiple devices running balenaSense, you'll want to keep track of which IP is for which setup.
Dashboard
Assuming your sensor is set up properly, and data is being collected and presented by various blocks, you should be able to access the default dashboard using one of the methods above. You'll see something like this:
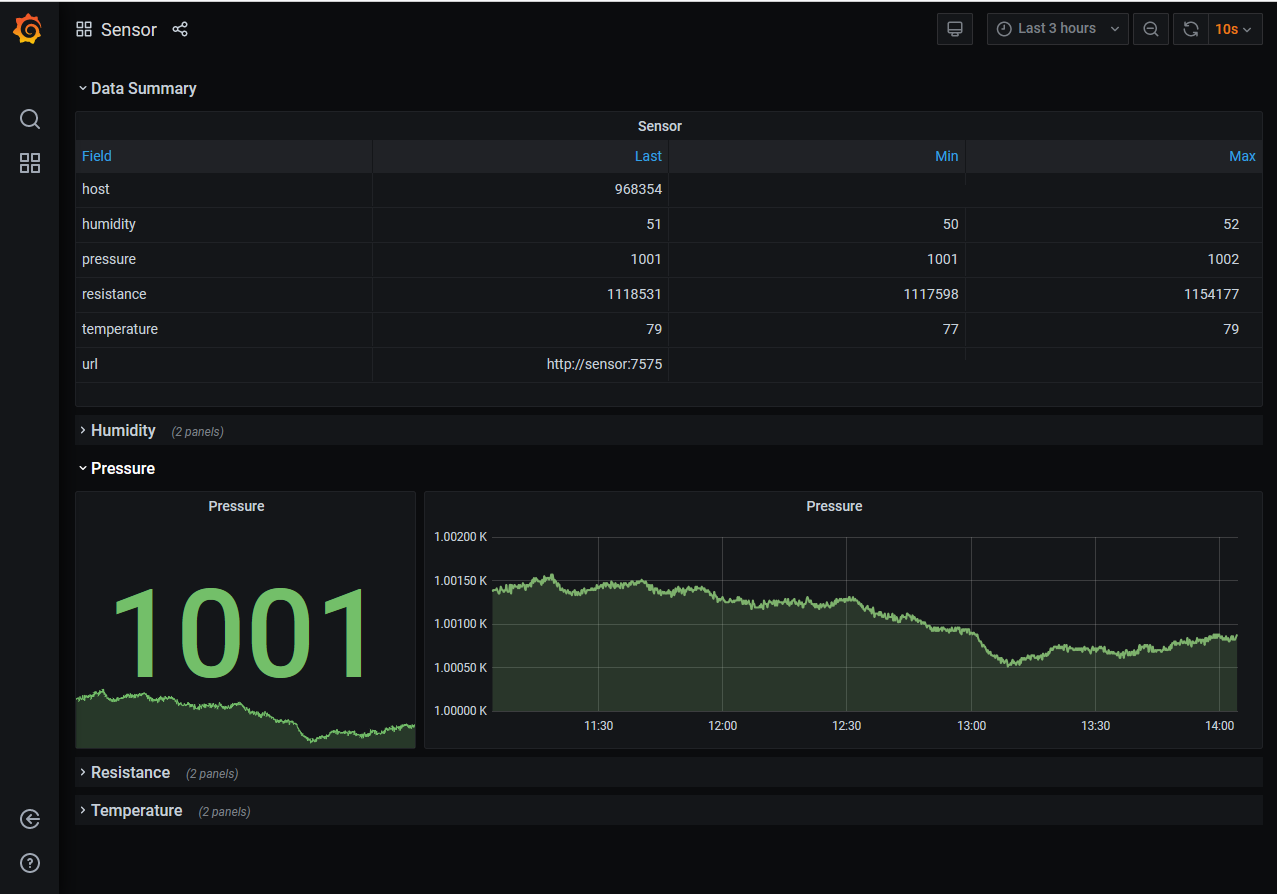
If you want to customize your dashboard, you'll want to sign into Grafana. The default username and password for your device is admin.
Follow our official project guide for detailed instructions on how to do this.